Vancouver Election Atlas
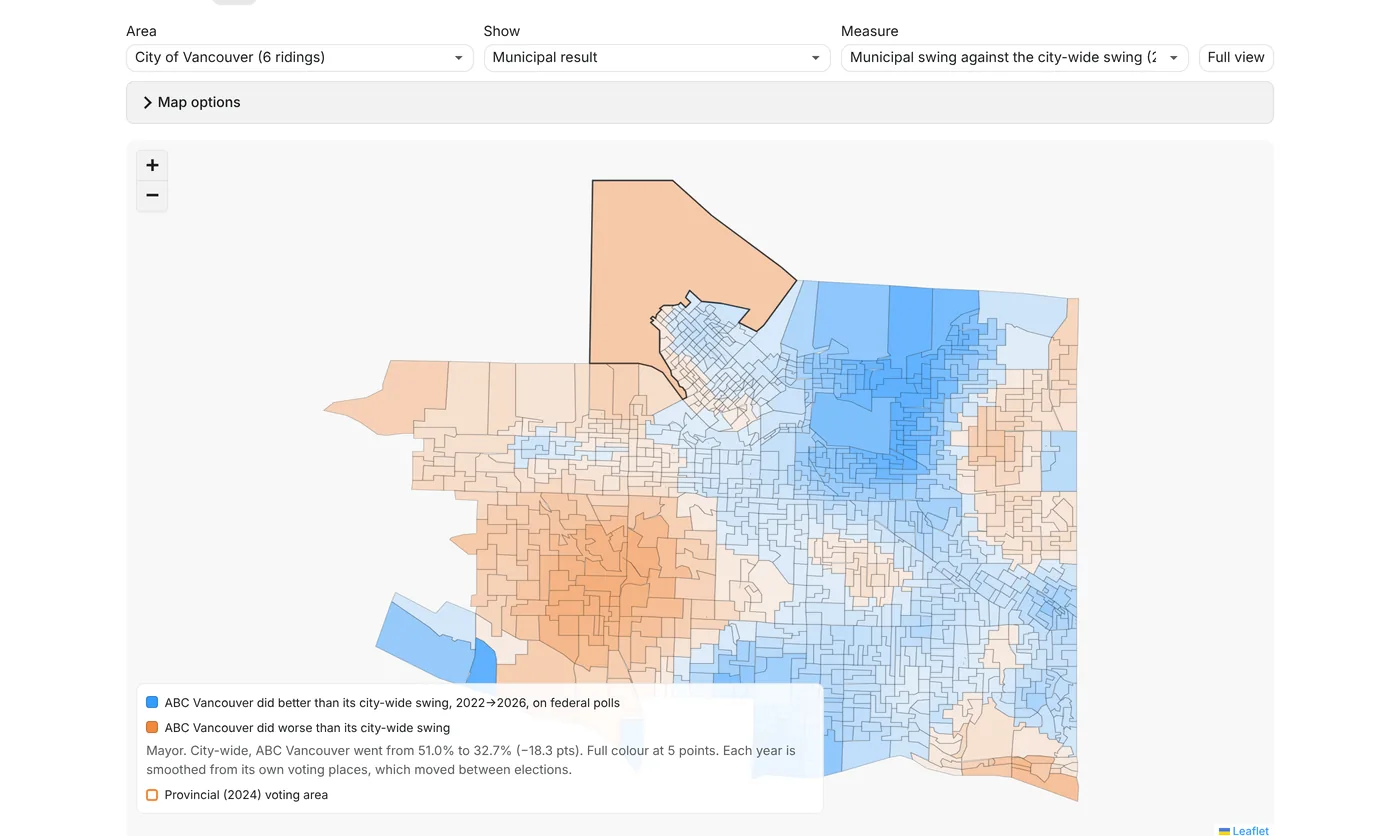
Federal, provincial and municipal results laid over one map of Vancouver, poll by poll, now with the 2026 civic election and its swing since 2022.
What it does
One map of the City of Vancouver with federal polling divisions and provincial voting areas stacked on top of each other, and the 2026 civic results spread across both. Click anywhere and it tells you which poll and voting area you're in, and how each one voted.
What you can do with it
Compare how the same streets voted federally, provincially and municipally, see how each civic party's vote swung between 2022 and 2026 area by area, rank every area by turnout, and find where the non-voters are. It opens with the 2025 federal, 2024 provincial and 2022 and 2026 Vancouver civic results already loaded, so you can start exploring straight away.
Data and licences
Federal: Elections Canada poll-by-poll results for the six City of Vancouver ridings, 2025 general election. Contains information licensed under the Open Government Licence – Canada. Provincial: Elections BC 2024 voting areas, results by voting place and registered voters. Contains information licenced under the Elections BC Open Data Licence. Municipal: City of Vancouver 2022 and 2026 election results by voting place and voting places. Contains information licensed under the Open Government Licence – Vancouver. This is an independent project and isn't endorsed by Elections Canada, Elections BC or the City of Vancouver.
Open Government Licence – Canada · Elections BC Open Data Licence · Open Government Licence – Vancouver
Every poll in the city on one map, with the 2022→2026 civic swing
- Federal polls
- 1,017 in the city
- Provincial areas
- 765 in the city
- Civic voting places
- 147 in 2026, all seven races
- Data
- Elections Canada 2025, Elections BC 2024, City of Vancouver 2022 and 2026
- Built with
- JavaScript, Leaflet, Python